Visualize and Analyze: Top Reporting Solutions for AppGini Users
AppGini makes it easy to build powerful database applications, but when it comes to reporting, you have multiple options—each with its own strengths. Whether you want instant charts, interactive dashboards, or the ability to ask questions in plain English, there’s a reporting tool that can fit your workflow. In this post, I’ll introduce four top reporting solutions that work seamlessly with AppGini: Summary Reports plugin, DataTalk plugin, Smart Report Maker, and Redash.
1. Summary Reports Plugin
Best for: Quick, interactive summary reports and charts directly inside your AppGini app.

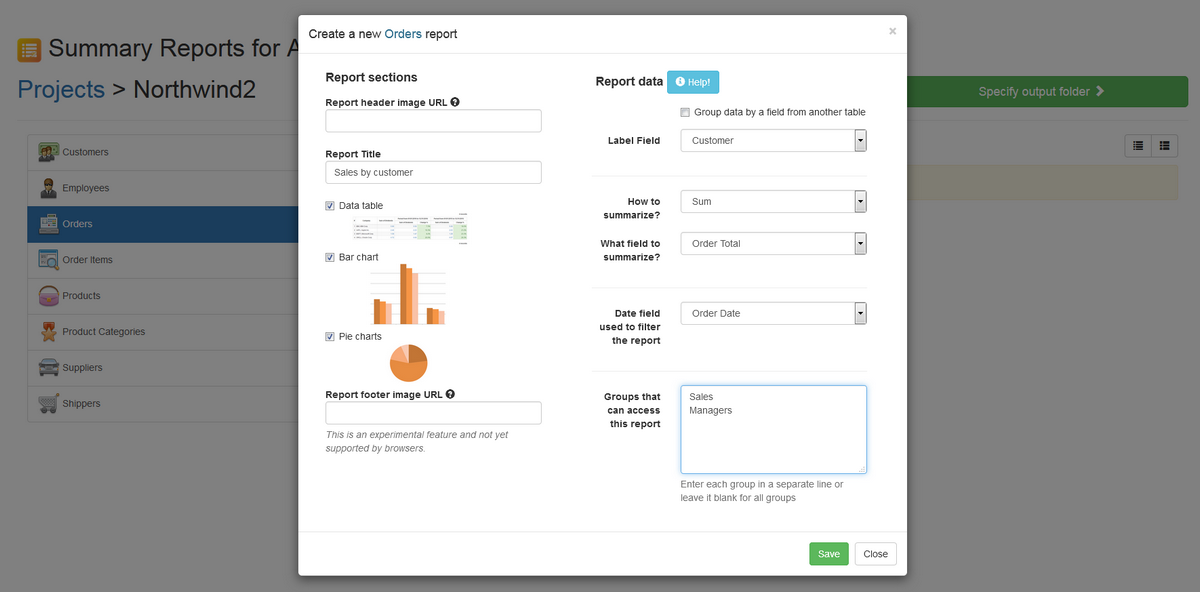
The Summary Reports plugin lets you summarize and visualize your data with just a few clicks—no SQL or programming required. You can group data by categories (e.g., total orders by customer), compare across multiple periods, and instantly see trends via bar and pie charts. The interface is user-friendly and interactive: filter by date, compare up to three date ranges, and drill down to the underlying records with a single click.
Key features:
- Summarize data by count, sum, average, max, min
- Visualize with bar and pie charts, easily customizable
- Export report data to CSV for further analysis in Excel
- Filter and compare by up to three date ranges
- Drill down to see detailed records
- Restrict report access per user/group
If you need quick business insights and beautiful visualizations right inside your app, Summary Reports is a fantastic choice.
2. DataTalk Plugin

Best for: Conversational data analysis—ask questions in plain English (or other languages).
DataTalk brings AI-powered querying to your AppGini apps. Instead of writing SQL, you describe what you need in your own words—“What are our top selling products this year?”—and DataTalk generates the right query and shows you the results. Reports can be saved, shared, or exported to CSV. The plugin is multilingual and keeps your data private: only your question and the database structure are sent to the AI (never your real data).
Key features:
- Ask questions in any language; no SQL needed
- Save, share, and export reports (static or live)
- Multilingual interface and natural language support
- Data privacy: your actual data never leaves your server
- Keeps question history to save costs and improve efficiency
This is a great tool for teams who want to democratize data access and let anyone explore the database—no technical skills required.
3. Smart Report Maker

Best for: Creating dynamic dashboards, scheduled reports, and charts with no coding.
Smart Report Maker (SRM) is a powerful, user-friendly reporting tool designed for MySQL databases—including those used by AppGini apps. It lets you build dashboards, drill-down charts, KPIs, and scheduled reports with a click-and-go interface. No coding or technical skills required—SRM connects to your database and empowers business users to create their own dashboards and reports.
Key features:
- Dynamic dashboards and charts
- Drill-down charts and KPIs
- Scheduled (automated) reports
- No coding required; easy install on any PHP hosting
- Exclusive discount for AppGini users
Ideal for teams who need robust, ready-made reporting outside AppGini, with the flexibility to build complex dashboards and automate reporting.
4. Redash

Best for: Advanced data visualization, dashboards, and sharing—if you have some technical skills.
Redash is a popular open-source platform for querying, visualizing, and sharing data. It supports MySQL (and many other data sources), and is perfect for teams ready to invest a bit more in setup for the sake of flexibility. With Redash, you can write SQL queries, visualize the results with a huge variety of chart types, create dashboards, and set up alerts. You can even use the DataTalk plugin to generate SQL queries and then run them in Redash!
Key features:
- Visualize data with dozens of chart types
- Build interactive dashboards and widgets
- Set up alerts (email, Slack, etc.) based on query results
- Share dashboards and queries with your team
- Connect to multiple data sources
Note: Redash requires installation (best on Linux, using Docker), and some technical skills to set up and manage.
Choosing the Right Tool
| Tool | Best For | Technical Skill Needed | Key Feature |
|---|---|---|---|
| Summary Reports | Internal summary reports & charts | Low | Click-to-create summaries & charts |
| DataTalk | Conversational querying | Low | Ask questions in plain English |
| Smart Report Maker | Dashboards, scheduled reports | Low | Drag-and-drop dashboards |
| Redash | Advanced dashboards & sharing | Medium/High | Full-featured visualization platform |
If you want quick, in-app summaries and charts, go with Summary Reports.
If you want to ask questions naturally, without SQL, try DataTalk.
If you need dynamic dashboards and scheduled reports, Smart Report Maker is a great fit.
If you want the power to build interactive dashboards and share them widely, and don’t mind some setup, Redash is your tool.
Of course, you can use multiple tools together! For example, you could create quick summaries with the Summary Reports plugin, then build more complex dashboards in Redash or Smart Report Maker. And you can even use DataTalk to generate SQL queries that you can run in Redash or Smart Report Maker.